Getting started
A first triggered average, from an empty signal chain. The same steps set up any of the four plugins — only what the canvas draws differs.
1. Put the plugin in a signal chain
Drag Triggered Avg from the processor list into the signal chain, downstream of whatever produces your continuous data.

Nothing here decimates or filters: what the plugin sees is what it averages. Put a downsampling or filtering plugin upstream if you need one.
2. Select channels
Use the editor's channel selector. Nothing is selected by default, and with nothing selected there is nothing to accumulate.
This is the main cost lever — everything downstream is linear in the number of selected channels. Start with a handful.
3. Set the trial window
Pre and Post, in milliseconds, are the two boxes on the editor's bottom row,
defaulting to 500 ms and 1000 ms. Both are locked during acquisition, as is the
channel selection: changing either discards everything collected so far.
4. Define your conditions
Open TRIGGERS and add one row per experimental condition. Each row names a TTL line and, optionally, three broadcast-message patterns.
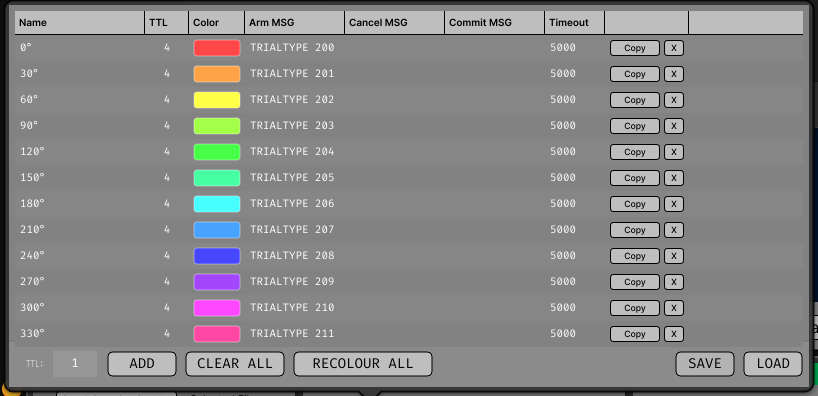
For a first run, one row with a TTL line and no message patterns is enough: it fires on every rising edge of that line. The message patterns — arming a condition on a trial-type message, committing or rejecting a trial on its outcome — are the subject of Triggers and messages, worth reading before a real experiment.
Type the table once
SAVE in the TRIGGERS popup writes the whole table to a small XML file, and LOAD
reads one back in any of the four plugins.
5. Acquire, and watch MONITOR
Start acquisition. Trials accumulate and the canvas fills in. If nothing appears, open MONITOR.
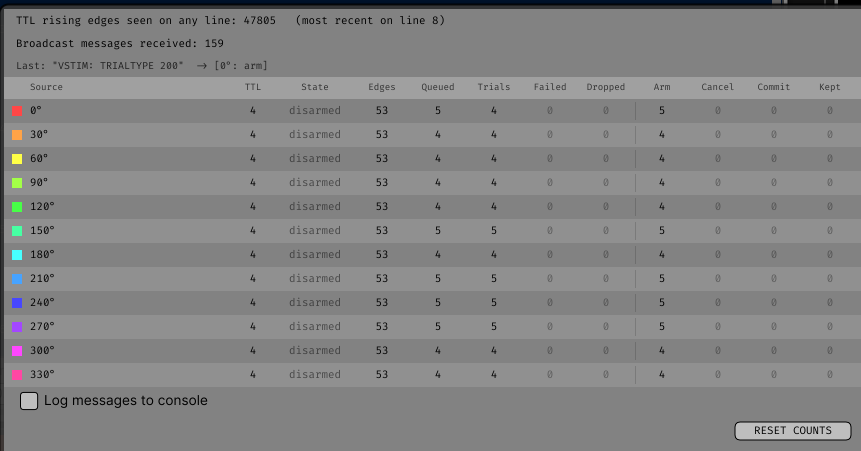
The stage where the count stops advancing is the stage that is broken:
| Counters | What it means |
|---|---|
EDGES stays at 0 |
Nothing is arriving on that TTL line. Wrong line number, or the events are not reaching this plugin. |
EDGES advances, QUEUED does not |
The source is gated by an arm pattern and is never being armed. Check the pattern against the message text MONITOR shows. |
QUEUED advances, CAPTURED does not |
The worker gave up on the windows — usually triggers arriving faster than the window is long, or a stream that stopped advancing. |
CAPTURED advances, nothing is kept |
The source has a commit pattern and no commit message is matching, or the pending timeout is expiring first. |
Its Log messages to console toggle echoes every incoming broadcast message to the GUI console along with the actions each source took from it, which is how patterns get shaped against real message text.
6. Read the canvas
Open the visualizer (the tab or window button on the editor).
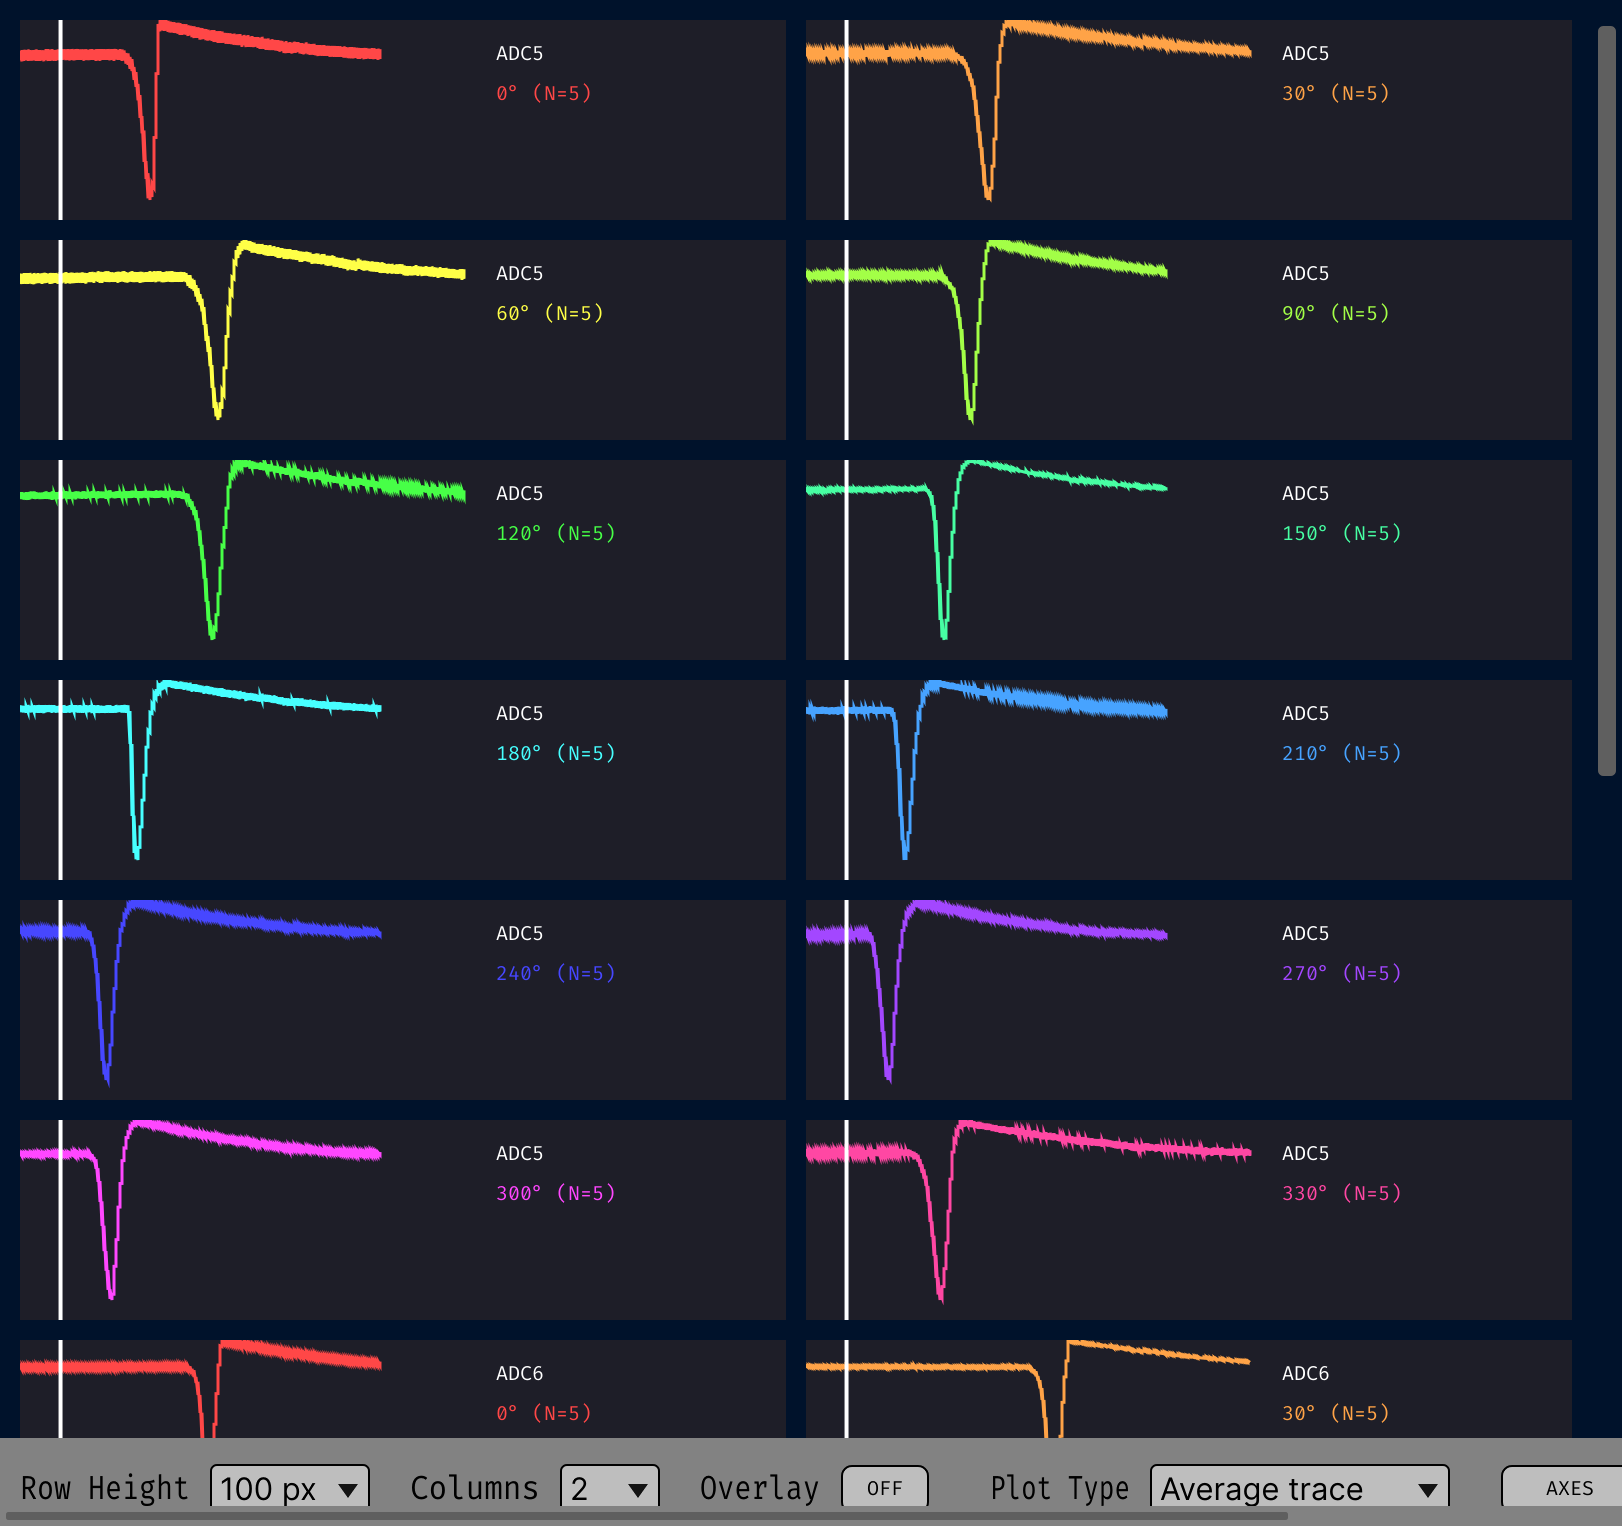
One panel per selected channel, with each condition in its own colour. The options bar
sets the plot type, grid layout, overlay and axis limits — all display controls, none of
which discard data. CLEAR discards the accumulated trials and keeps the conditions.
7. Save the result
SAVE in the canvas's options bar writes a session — a directory holding one XML
manifest and one .npy per array, plus any exported figures. It works during
acquisition. LOAD restores a session, and is disabled while acquiring.
See Saved sessions for the format, and the Python and MATLAB guides for reading one outside the GUI.
What to read next
- Triggers and messages — the arm/cancel/commit workflow.
- The page for the plugin you are using: Triggered Average, Triggered Power, Triggered Coherence, Receptive Field Bar Mapper.
- The Parameter reference.