Triggered Average
Time-domain average of continuous data around each trigger, split by condition, with the standard deviation and the individual trials.
Appears in the GUI processor list as Triggered Avg. It needs no FFTW runtime.
What it computes
For each condition, a running mean and population standard deviation over trials, per channel:
- the average is
sums / trial_count; - the standard deviation is the population one, over trials — divide by
sqrt(trial_count)for the standard error; - alongside them, a bounded ring of the most recent trials, kept for display only.
The accumulators are sums rather than averages, so folding a trial in is exact and a resumed session continues the same estimate.
Editor
| Control | Notes |
|---|---|
| TRIGGERS | The condition table — see Triggers and messages. |
| MONITOR | Per-source counters. |
| ANALYSIS | One parameter: Max Trials. |
| Channels | Locked during acquisition. |
| Pre / Post | 500 ms and 1000 ms by default. Locked during acquisition. |
ANALYSIS → Max Trials
Individual trials retained per condition. Default 10, range 1–50.
This is the depth of the per-condition ring the canvas draws individual traces from. It does not limit how many trials go into the average — that is unbounded.
It resizes the per-condition trial buffers, so it is locked during acquisition and changing it discards what has accumulated.
Canvas
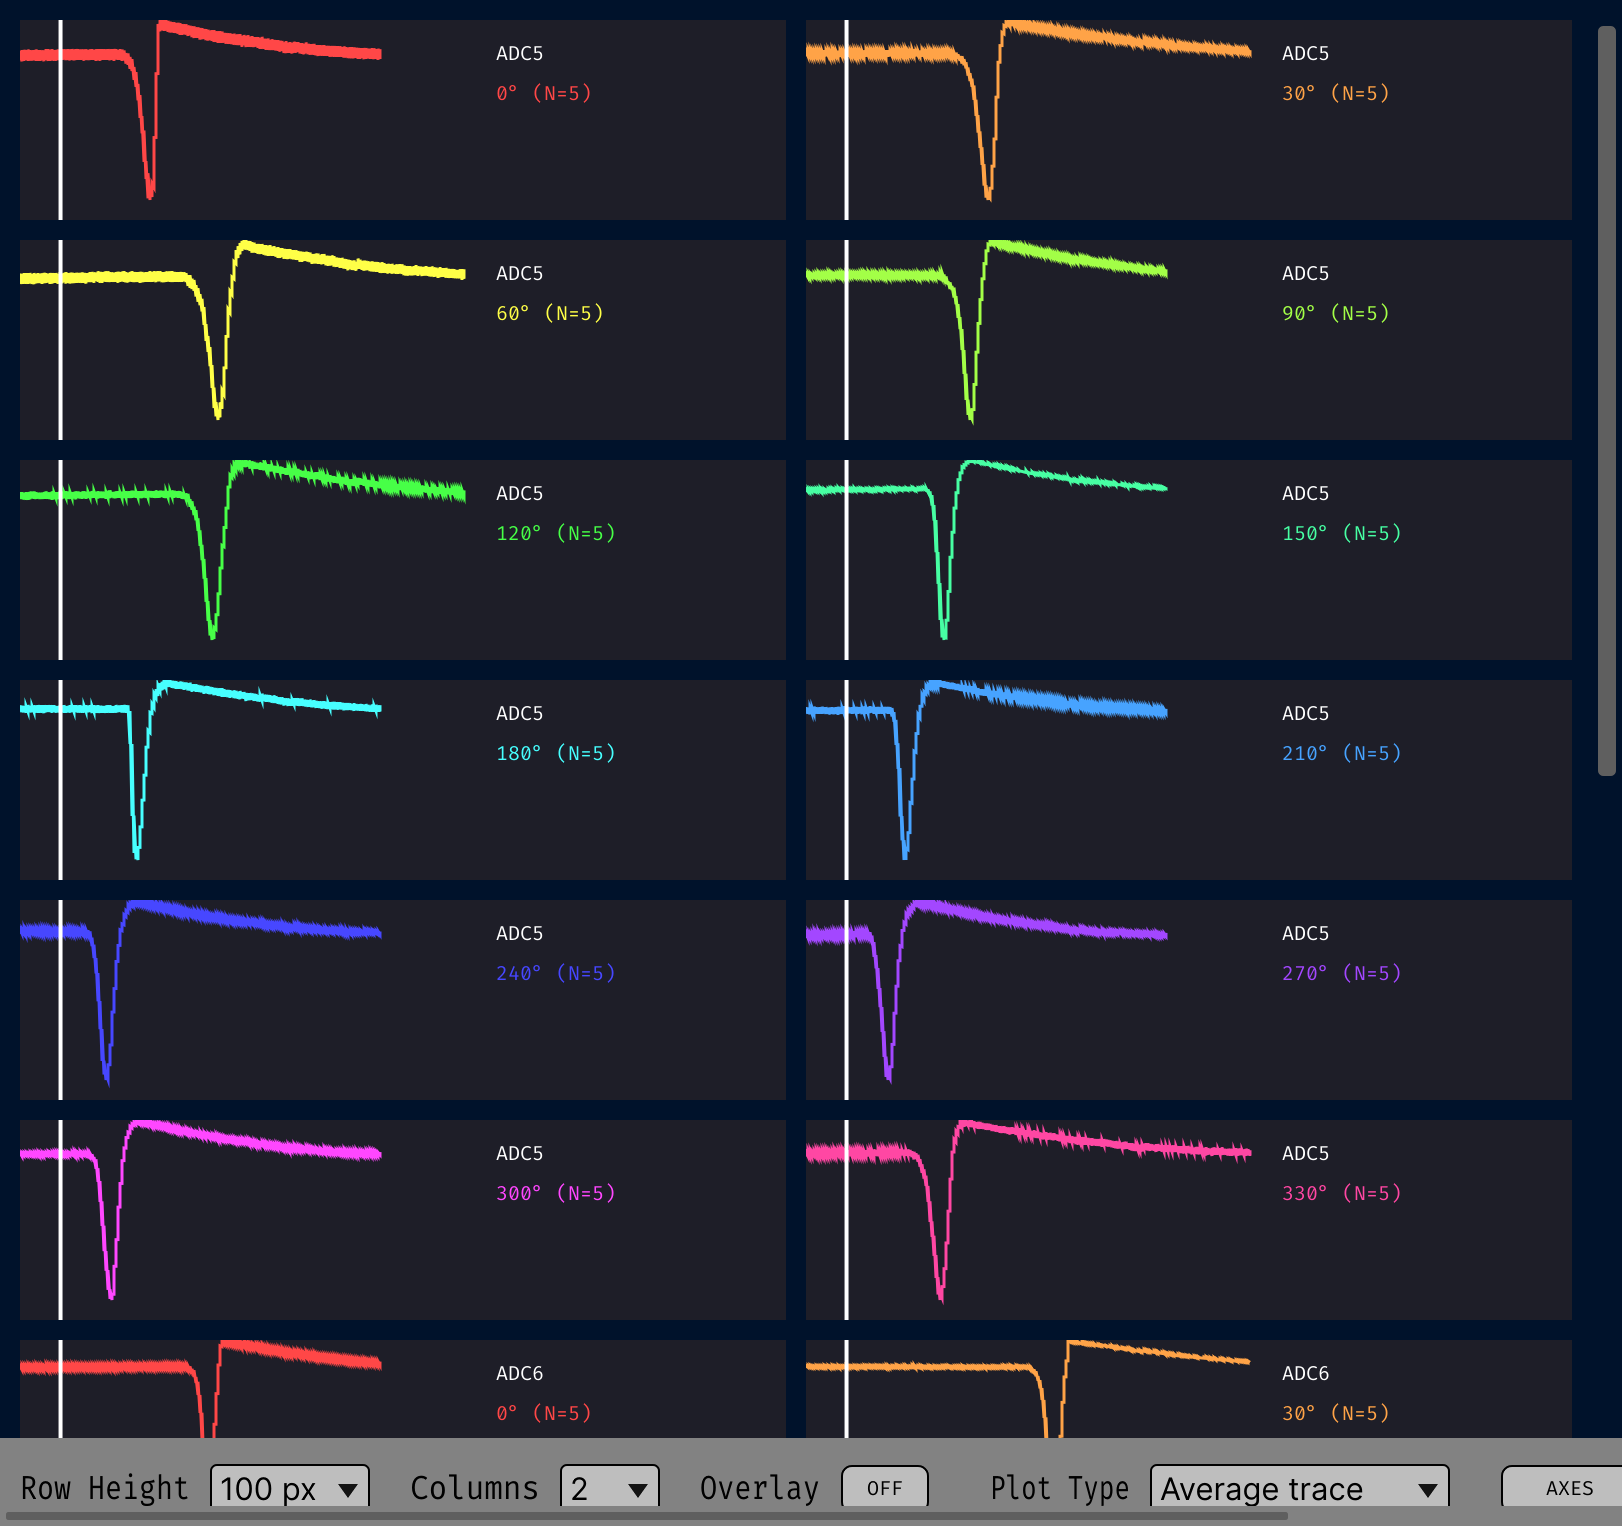
One panel per selected channel, with each condition drawn in its own colour. Nothing in the options bar discards data: these are display controls, applied when the display reads the accumulators.
| Control | Effect |
|---|---|
| Plot type | All traces, Average trace, or Average + All. |
| Columns | Panels per row in the grid. |
| Row height | Panel height, 50–… px. |
| Overlay | Draw the conditions on shared axes rather than side by side. |
| AXES | Both axes' limits, in a popout — see below. |
| CLEAR | Discards accumulated trials, keeps the conditions. |
| SAVE / LOAD | Sessions. SAVE works during acquisition; LOAD does not. |
AXES
| Control | Effect |
|---|---|
| X-Axis (ms) | AUTO fits the whole captured window; MANUAL uses the min and max typed beside it. The range is clamped to [-pre_ms, post_ms], and the popout shows what that window currently is. |
| Y-Axis (uV/V) | AUTO scales each panel to its own data; MANUAL pins every panel to the range typed beside it. With it off, the average and the individual trials are normalised to the same range. |
A range typed with its ends the wrong way round is not applied. Both ranges are kept
whether or not they are in use, so switching an axis back to MANUAL finds the numbers
last typed.
The axis-limit parameters are display-only and never discard accumulated data.
Sessions
SAVE writes the accumulators plus what the canvas draws:
| Array | Shape | dtype | Contents |
|---|---|---|---|
sums |
(sources, channels, samples) | float32 | Summed trials — the resumable state |
sum_squares |
(sources, channels, samples) | float32 | Summed squares — the resumable state |
trial_counts |
(sources,) | int32 | Trials folded in per condition |
averages |
(sources, channels, samples) | float32 | sums / trial_counts, what the canvas drew |
standard_deviations |
(sources, channels, samples) | float32 | Population SD over trials |
time_ms |
(samples,) | float64 | The time axis, trigger at 0 |
The derived three are outputs, not state: LOAD ignores them and rebuilds the averages from the sums. They are written anyway so that a reader gets the mean trace and the time axis without recomputing them.
A condition with no trials is written as zeros rather than NaN; trial_counts is what
says so. The single-trial ring is not saved — it is a display buffer, not part of the
estimate.
See Saved sessions.
Parameters
Full list with defaults, ranges and scope: Parameter reference → Triggered Average.